
Social Security Disability
Arizona Disability Approval Rates, by Stage and by Hearing Office

Arizona denies more initial disability claims than nearly any other state, but its hearing offices approve claims at a higher rate than the national average once a judge reviews the case. This article explains that gap, using Social Security’s own published data, and what it means for someone deciding whether to appeal a denial.
The figures below are computed directly from Social Security’s own published files — the state agency workload dataset and the hearing office disposition data — rather than from estimates or third-party aggregators. The method and the data limitations are described at the end of this article, so the arithmetic can be checked.
The Short Version
In fiscal year 2025, Arizona allowed 31.5 percent of initial disability claims. The national figure was 36.0 percent. That places Arizona 50th out of 51 jurisdictions — the fifty states plus the District of Columbia. Only Kentucky was lower.
For SSDI claims specifically, including concurrent SSDI and SSI filings, the Arizona initial allowance rate was 27.3 percent against a national 33.0 percent.
At the hearing level, the pattern reverses: Arizona’s three hearing offices together allowed 61.0 percent of the cases judges decided in fiscal 2025, against a national rate of 58.3 percent.
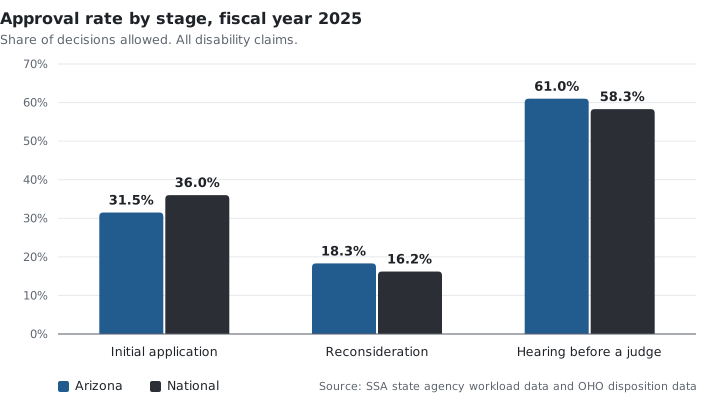
This comparison matters for how to read a denial letter. Because Arizona’s initial approval rate is so far below its hearing-level rate, an initial denial here says less about the medical strength of a case than a denial in most other states would. The stage at which a claim is decided affects the outcome as much as the medical record does.
Stage One: Initial Approval Rates in Arizona
Initial claims in Arizona are decided by Arizona Disability Determination Services, a state agency working under federal rules. Every state runs one. They apply the same regulations, and they produce strikingly different results.
| Fiscal year 2025 | Arizona | National |
|---|---|---|
| Initial, all disability claims | 31.5% allowed | 36.0% allowed |
| Initial, SSDI and concurrent claims | 27.3% allowed | 33.0% allowed |
| Reconsideration, all claims | 18.3% allowed | 16.2% allowed |
| Reconsideration, SSDI and concurrent | 18.1% allowed | 16.0% allowed |
SSDI claims fare worse than the all-claims average. If you worked long enough to qualify for Social Security Disability Insurance, your initial odds in Arizona were roughly one in four, not one in three.
Arizona’s reconsideration rate is slightly better than the national one. Reconsideration is a low-yield stage everywhere — roughly one in six claims nationally, a little under one in five in Arizona. Arizona’s approval problem is concentrated at the initial stage, not at reconsideration.
Stage Three: Hearing-Level Approval Rates by Office
Arizona has three Social Security hearing offices: Phoenix Downtown, Phoenix North and Tucson. Which office you are assigned depends on where you live. The office can affect the outcome, as shown below. For how that assignment is made and what it means market by market, see which Arizona disability hearing office handles your case.
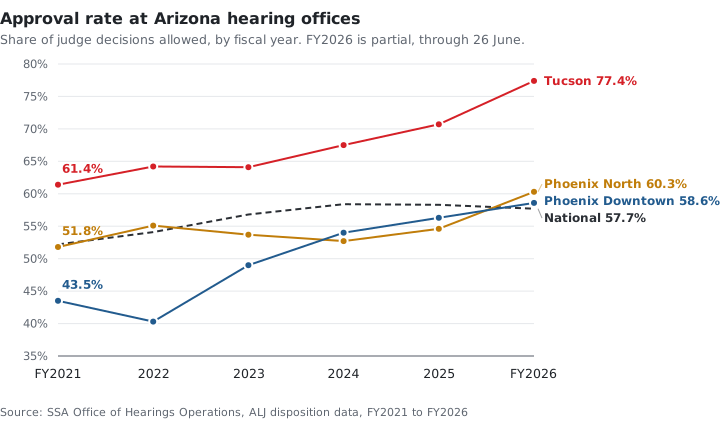
Tucson ranked 12th of 167 hearing offices nationally in fiscal 2025. In the first nine months of fiscal 2026 it ranked first in the country, though a partial year is a less reliable basis for a ranking than a full year.
Phoenix Downtown’s approval rate followed a different path to a similar result. It was 43.5 percent in fiscal 2021, well below the national rate, and has risen every year since to 58.6 percent. If you compare notes with someone whose Phoenix hearing took place in 2021, you are comparing very different periods.
| Hearing office | Approval rate, FY2025 | Average wait, FY2025 | Average wait, FY2026 to date |
|---|---|---|---|
| Tucson | 70.7% | 296 days | 296 days |
| Phoenix North | 54.6% | 364 days | 350 days |
| Phoenix Downtown | 56.3% | 317 days | 273 days |
| National median | 58.3% | 276 days | 258 days |
Waits in Arizona are longer than the national median at every office, though they are falling at two of the three.
One caution about Phoenix North. Its incoming caseload has dropped sharply: 1,120 new cases in fiscal 2025, then 284 in the first nine months of fiscal 2026, while it decided 809. That pattern usually means an office is being wound down or consolidated. If you are told your case is assigned there, ask what that means for your schedule before assuming the numbers above still apply.
Hearing Dismissals
The approval rates above are calculated the way they are usually quoted: allowances as a share of the cases a judge actually decided. That figure does not include dismissals.
Nationally, 16.7 percent of hearing-level cases end in a dismissal rather than a decision. Dismissals are overwhelmingly the result of a missed deadline, a request filed too late, or a claimant who did not appear, rather than a judge weighing the medical evidence and denying the claim.
Including dismissals in the denominator changes the picture:
| Fiscal 2026 to date | Share of decisions allowed | Share of all cases allowed |
|---|---|---|
| Tucson | 77.4% | 64.2% |
| Phoenix North | 60.3% | 49.9% |
| Phoenix Downtown | 58.6% | 46.0% |
| National | 57.7% | 48.1% |
At Phoenix Downtown, the difference between those two columns is roughly thirteen percentage points. Most of that gap reflects missed deadlines and procedural dismissals rather than the medical merits of the claims.
You have 60 days from the date on your denial notice to appeal, plus a five-day mailing allowance. Missing that deadline is one of the most common ways an Arizona disability case is lost, separate from the medical merits of the claim.
The Spread Between Judges Is Wider Than the Spread Between Offices
Social Security publishes approval rates for every individual administrative law judge. The variation among judges within a single office is larger than the variation between offices.
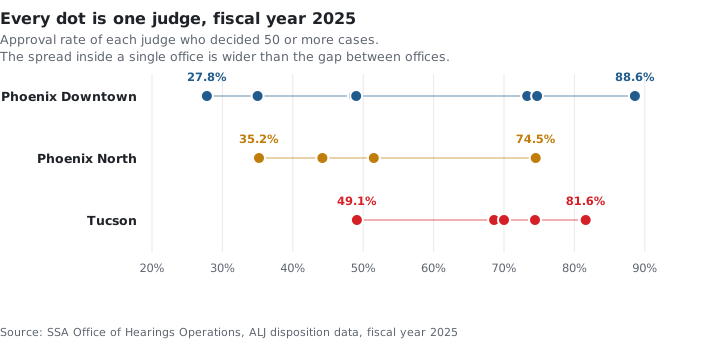
At Phoenix Downtown in fiscal 2025, the least favorable judge allowed 27.8 percent of the cases they decided and the most favorable allowed 88.6 percent. That is a sixty-point spread among judges applying the same regulations in the same building.
This article does not name individual judges. Assignments rotate, rates move year to year, and claimants do not choose which judge hears their case.
You do not control which judge is assigned to your case. Prepare a hearing file strong enough to hold up before any judge in the office, not only a favorable one. That is the basic argument for preparing a hearing thoroughly, and it follows from Social Security’s own numbers.
How Long All of This Takes
Adding the stages together, the total process is typically measured in years rather than months.
| Stage | What happens | Typical elapsed time |
|---|---|---|
| Initial application | Arizona DDS gathers records, may order an exam | Commonly 3–6 months |
| Reconsideration | A different DDS examiner reviews the file | 3–6 months, sometimes longer |
| Hearing | Request, scheduling, hearing, decision | 273–350 days on current office averages |
If you are denied twice and then scheduled for a hearing, you are realistically two to three years from a final answer, measured from the day you first applied. The hearing-office figures in that table are published averages; the first two rows are ranges we commonly see, not predictions.
Plan financially for that timeline. A two-year gap is harder to absorb when it was expected to take six months. Social Security does have expedited paths for claimants in genuinely dire circumstances, and the companion article to this one covers how to use them.
Where the Numbers Come From
Initial and reconsideration figures are computed from Social Security’s State Agency Monthly Workload Data, file version 2, updated 24 July 2026, covering October 2000 through June 2026. Rates are calculated by summing allowances and determinations across the fiscal year, not by averaging monthly percentages.
Hearing office figures come from Social Security’s public hearings and appeals data files — the ALJ disposition data and hearing office workload data published by the Office of Hearings Operations, together with the archived September files for fiscal years 2021 through 2025. Fiscal 2026 figures cover the period ending 26 June 2026 and are partial.
Social Security notes three limitations on this data:
- State means the deciding agency, not your address. States with heavy caseloads transfer claims to other states, so Arizona’s figures describe cases decided by Arizona DDS, not every claim filed by an Arizona resident.
- Reconsideration data is not longitudinal. A reconsideration in a given month does not correspond to an initial denial from the same agency, so a reversal rate for a specific group of claimants cannot be derived from these files.
- An allowance is a medical finding. A claim allowed by DDS can still be denied afterward on non-medical grounds such as work credits or income.
Figures are current as of the files published through July 2026. Social Security updates both datasets periodically, and we will update this page when the numbers move.
What to Take From All This
If you were denied in Arizona, this data supports three conclusions, and does not support a fourth.
A denial in Arizona is weak evidence about the strength of a case, because this state denies initial claims at nearly the highest rate in the country. The hearing is where Arizona cases are most often won, because the approval rate more than doubles at that stage. And missing the appeal deadline is a real risk, because dismissals cost claimants more approvals than unfavorable judges do.
This data does not support a prediction about any particular claim. No statistic can determine what will happen with an individual file. What it does show is that giving up at the denial letter means giving up before the stage where the odds change.
For what to do in the sixty days after a denial, see what to do after an SSDI denial in Arizona. For more on why the process takes as long as it does, see our article on that topic.